What Are the Three Pillars of Observability?
The traditional three pillars of observability are considered logging, metrics, and tracing. These three data types are essential for building a reliable, scalable, and maintainable system. Logs, metrics, and traces are essential to observability because they provide different types of data that enable IT engineers to understand how a system is behaving and diagnose issues when they arise.
This blog looks at these three pillars and analyzes how Riverbed takes them further to unify data, insights and actions for all IT.
What are logs?
Logs refers to the collection of data generated by an application or system as it runs. Logs record events that happen within a system and provide a detailed record of its behavior. Logs are important because they record events and activities that happen within a system, providing a detailed history of its behavior. Logs are helpful for debugging issues, troubleshooting, and auditing. When something goes wrong, logs can help engineers identify what happened and when, as well as providing clues as to why it happened.
What are metrics?
Metrics are numerical values that represent the behavior of a system over time. They are typically collected at regular intervals and can be used to track trends and identify anomalies. Metrics are often used to monitor system performance, such as CPU usage, memory utilization, or traffic throughput.
Metrics are important because they provide data that can be used to track system performance over time. By collecting and analyzing metrics, engineers can identify patterns and trends, which allows them to optimize performance, troubleshoot issues, and make informed decisions about system capacity and resource allocation.
What are traces?
Traces refer to the ability to follow a request as it moves through a distributed system. Tracing helps engineers identify the source of a problem, understand the flow of data, and optimize the performance of a system. Tracing involves instrumenting the code and collecting data at various points in the system, then aggregating and analyzing that data to create a trace of a request’s journey. Traces making it easier to diagnose and resolve problems. They can help identify where performance bottlenecks are occurring and help pinpoint the root cause of issues.
Together, the three pillars of observability provide a comprehensive view of a system, enabling engineers to monitor, debug, and optimize it. They form the foundation of observability, allowing engineers to gain insight into complex systems and improve their reliability, scalability, and maintainability.
Riverbed Unified Observability unifies data, insights and actions across IT
Alluvio IQ is a SaaS-delivered unified observability service that captures full-fidelity performance metrics, applies machine learning and correlation to identify to separate false positives from critical events, and then automates the investigative workflows of IT experts to gather the diagnostic data necessary to resolve problems quickly.

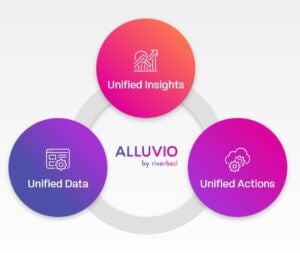
Alluvio unifies data, insights and actions across IT.
In short, Riverbed expands on the three pillars of observability to deliver an observability solution that unifies data, insights, and actions for all IT.
Unified data is the comprehensive support of full-fidelity telemetry from across diverse sources, including devices, networks, applications, cloud-native environments, users, and third-party solutions. Unlike other solutions that sample data to deal with the scale of today’s distributed environments, Riverbed captures every transaction, packet, and flow, as well as actual user experience for every type of application. Full-fidelity data gives IT a complete picture of what’s happening and what has happened, without missing key events due to sampling. It provides the foundation of unified observability.
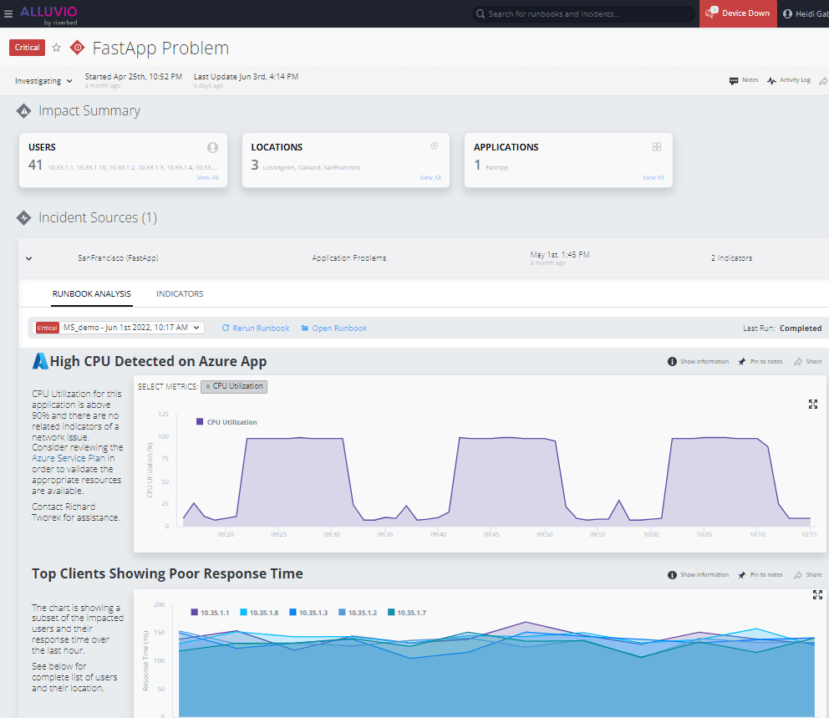
Unified insights mean IT solves the right problems fast to keep users productive. With the best data, AI and multifaceted correlations, plus workflow automation, Alluvio IQ delivers context-rich, filtered, and prioritized insights that help IT teams understand the scope and severity of issues and the cause of poor performance.

Alluvio IQ pulls together all evidence related to an incident in a single report, which can also be used in inform trouble tickets.
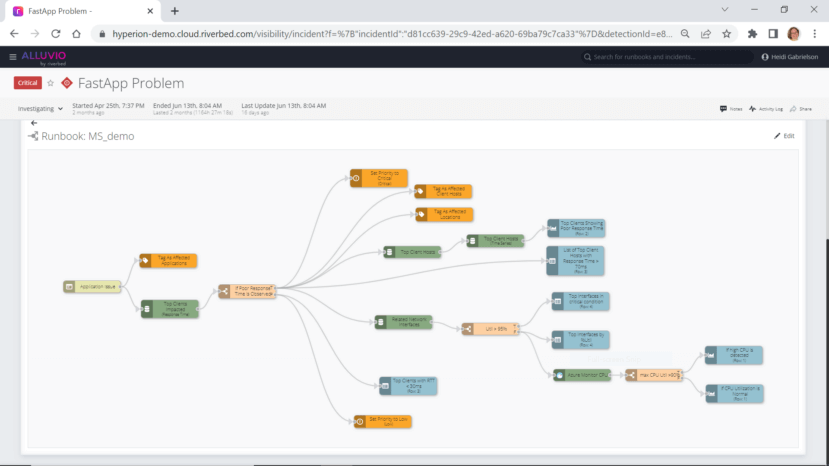
Unified actions employs low-code runbooks to replicate and automate the best practices of IT experts to provide probable root cause of performance of security incidents. By automating the gathering of supporting diagnostic data from disparate solutions, Alluvio IQ helps IT teams accelerate problem-solving, break down silos, and avoid time-consuming war rooms.

Alluvio IQ runbooks automate the process of gathering diagnostic data to speed time to resolution.
Why Alluvio IQ Unified Observability?
Alluvio IQ Unified Observability unifies data, insights, and actions to empower all IT teams to deliver seamless digital experiences and end-to-end performance visibility. It uniquely leverages a combination of enterprise-wide data collection, sophisticated AI techniques, and intelligent automation to speed common and repetitive IT tasks. As a result, IT can achieve the following benefits:
- Faster problem detection and resolution: With unified observability, it becomes easier to detect problems as they occur, rather than waiting for user complaints or failures. Once a problem is detected, Alluvio IQ can help pinpoint the root cause of the issue. Alluvio Unified Observability uses intelligent automation to gather supporting evidence and context. This reduces the time it takes to resolve the problem and get the system back up and running.
- Better performance: By monitoring key metrics and indicators, unified observability helps identify performance areas that are not optimal. This can help improve performance of networks, applications, and users and prevent potential issues before they occur.
- Improved collaboration: Observability tools can provide visibility into the IT environment to multiple teams across an organization. This visibility can improve collaboration between teams and help everyone work towards a common goal of improving performance and reliability.
- Better customer experiences: By resolving problems faster, Alluvio IQ helps improve digital experiences, which leads to increased customer satisfaction and loyalty.
Extend the three pillars of observability to include unified data, insights and actions.

Leave a Reply