Analytics Control Alluvio IQ
According to Gartner, analytics and AI continue to be the top IT and business investment priorities for organizations’ digital transformation initiatives. Emerging technologies, such as AI, improve process efficiency, enable faster decision-making with access to data, and enhance customer experiences across business domains.
Forrester Research has disclosed that without the comprehensive insights they need to succeed, technology leaders are struggling to keep up with business demand and enable future growth. The modernization of IT operations is coming at these leaders from multiple areas. It centers, however, on the need for operational insights to drive value-based and AI-driven actions.
Forrester also feels various capabilities must work together for observable insights to deliver value and, therefore, defines these four functionality categories of observability:
- Telemetry data is the bedrock of observability. This is the origination of all data and telemetry that an observability solution might leverage.
- Exploration leads to a deeper understanding of entities. The aggregation, standardization, and time series collection of telemetry data prepare it for analysis and processing.
- Insights surface important opportunities to act on. The application of AI/ML and other data science approaches identify patterns, trends, correlations, and anomalies.
- Utilization of insights delivers high value. The insights surface so the organization can take proper actions to remedy or prevent various scenarios. The goal is to progress from predominantly manual consumption and dissemination toward analytics-based automated remediation and issue avoidance as maturity grows.
Alluvio IQ leverages analytics
Alluvio IQ follows these four functionality capabilities to provide actionable insights for our customers. It extensively leverages analytics, including machine learning (ML) and artificial intelligence (AI), to identify business-impacting events and reduce the noise from low-level or related incidents.
A quick overview of Alluvio IQ’s capabilities to set the background for our analytics discussion and to show how it supports Forrester’s observability functionality categories: Key metrics from Alluvio full-fidelity data are gathered, distributed, and accessed through the Data Ocean. A subset of the metrics stream through the Analytics Pipeline to monitor the health and performance of the IT environment and alert on anomalies. The anomaly data is then accessible to the Runbooks for no-code investigations, which gather contextual information about the incident to expedite impact assessments, troubleshooting, and resolution times.
The Analytics Pipeline receives all key metrics to aid in the detection and correlation of anomalies. It processes them through multiple stages to reduce the noise associated with too many alerts:
1. Anomaly Detection
As metrics flow through the Analytics Pipeline, they are monitored for anomalies that could be leading indicators of issues. These indicators are then associates with a monitored object (i.e. Application, Device, or Interface) to provide metric-relevant context, including associated metadata.
Alluvio IQ applies machine learning and AI algorithms, like baselining, and variance to detect anomalies and surface potential problem indicators. It also leverages thresholds to set high watermark indicators.
- Thresholds are simple “trip-wires” applied to metrics that will quickly create an indicator when the associated threshold is violated. For example, thresholds are used to detect issues like device down or when interface utilization is above 90%. Thresholds work well in situations where there is a known range, such as interface utilization. Threshold are also paired with a baseline to handle cases where high values are normal.
- Baselines are a method of assessing performance or behavior by comparing it to a historically derived baseline. Baselining is useful for handling performance metrics that do not have a fixed range, and where it is difficult to know when a performance indicator has entered a bad state. For example, organizations today use hundreds of applications, and the performance across the applications varies widely. Static threshold for latency or response time across all applications does not work, so we use baselines to learn what is the normal behavior for each application and then create anomalies when the applications metrics are outside of the normal range
- Variance analysis is the comparison of predicted and actual outcomes.
The Alluvio engineer and data science teams are continuously updating Alluvio IQ with more machine learning tools (i.e. algorithms) to grow and improve its AI capabilities.

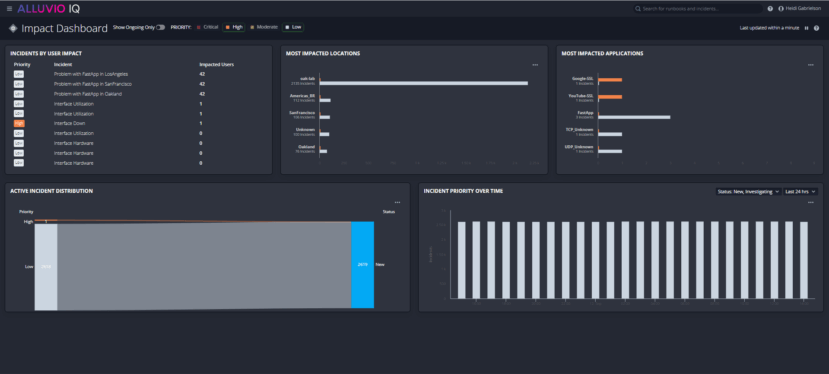
The Alluvio IQ Impact Dashboard reflects the results of the analytics analysis and displays results according to impact on the business.
2. Correlation Engine
The correlation engine determines if there is any commonality or relationship between the detected anomalies. This is done to reduce noise. It organizes indicators into associated groupings to correlate related indicators through use of time, location, connection, and relationship maps.
3. Incident Manager
The incident manager assesses the newly reported detections to determine if they constitute a new incident or if they are associated with an existing incident. A trigger is generated for new incidents so that the proper Runbook can be executed automatically.
For more information on Alluvio IQ and how it leverages analytics and runbooks to provide actionable insights that aid customers in faster, more efficient troubleshooting, click here.

Leave a Reply