NetIM Revamps Alerting
Riverbed NetIM infrastructure monitoring release (version 2.4) has new and improved alerting. We’ve reimagined the alerts page, adding the notion of active alerts. NetIM also started on the journey toward alert suppression with Site-based Gateway suppression.
Tangential to the topic of alerting, NetIM added a new Synthetic Test Object View Page and an IP SLA Views Page. The new Synthetic Test Object View page has four tabs that show results, alerts, browse configurations, and metrics. And, the IP SLA Views page allows you to view, navigate and search through all the IP SLA test results you’ve collected via polling.
This is a big and exciting release, so let’s dig into the details and explore the ins and outs.
Re-imagined alerts page
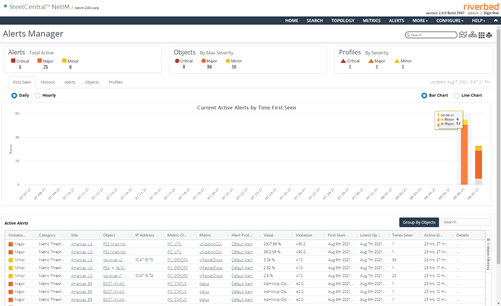
The NetIM alerts page and alerts banner has been reimagined from the backend and the frontend. What we are providing now is a view and count of what is in the active threshold violation. This is the “right now” view. It’s not time-based. We also provide aggregation of the counts, views into the counts, and the ability to filter the active alerts and the counts. Note that the Time-base Legacy Alerts page is still available.
The alerts page is organized into three sections. The top section is the alert banner that aggregates alerts in three ways.
- Alert Counts by Severity
- Affected Objects currently in Alert
- Count of Alert Profiles that are triggering active threshold violations
We have multiple tabs that you can use to slice and dice and view the alerts that are in an active state, for example, Alert Counts by Object Type, Metric Class and Metric Name. You can also aggregate and view Affected Objects in Alert and Affected Geographic Region/Country. Another view NetIM provides is Alert Count by Alert Profile. This provides you with information on which of your defined alerts are causing the devices or objects to be in alert at that time.
There are lots of features in the Active Alerts view. The Active Alert Table has filtering. You can launch a Quick View of the metric. You can search and perform grouping within the table. You can customize the columns per user, and you can download the entire table to CSV.
NetIM also gives you two historical alert views so you can see when things went into alert first and when you had the most things in alert.

The new Alerts manager pager reimagines how alerts are handled in NetIM 2.4
Alert suppression
Alerts can be suppressed to avoid generating too many alert entries or too many non-actionable alerts when the triggering condition occurs often. In this case, the site-based gateway alert suppression allows you to suppress all related devices and interfaces if the gateway is down. That way you only receive the one gateway alert. Once the site gateway is fixed, it should fix most, if not all the device and interface alerts. And, you don’t have all these extraneous alerts hiding the issue.
To put it another way: if all configured site gateways are down, then all notifications for all devices & interfaces configured for that site are suppressed. If at least one gateway device is up for a site, then all configured notifications are sent. You can configure Site Gateway suppression by going to Settings/Organize. There is also the Notification setting you must configure.
IP SLA Views page
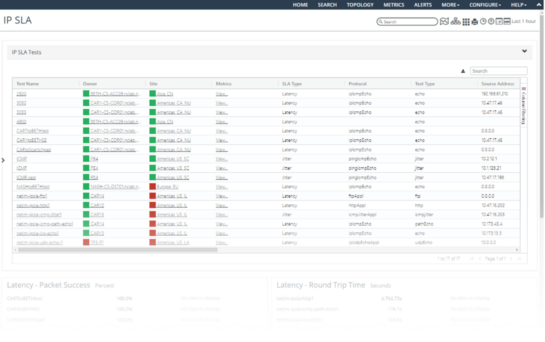
NetIM still supports Cisco and Juniper IP SLA tests and the polling is configured at the device level. What’s changes is the IP SLA Views page and IP SLA tabs for source and destination device of the test as well as the associated site and group. This Views page is launched from the menu item “More” and allows you to view and navigate through all the IP SLA tests you have in your managed network. It supports search, filtering, or a Metric Quick View and a drill down to the source and target device and the site. Additionally, in the section below the table, you can view Top-N tests by various metrics.

NetIM 2.4 adds an IP SLA Views page so you can easily view all your test results in one place.
You can now view the IP SLA tests scoped to device, site or group. Finally, we provided an IP SLA page. This is a page dedicated to each IP SLA test. It provides the test configuration and the test metrics.
Synthetic Test Object View page
The Synthetic Test Object View page has four tabs that show at-a-glance results, browse configurations, associated albums, and metrics. In addition, the Synthetic Test TCP Port and other configuration properties are now available within Portal.

The Synthetic Test Object View page shows at-a-glance results, browser configs, associated alarms and metrics.
Reporting enhancements
NetIM now supports business hours, multiple discontinuous time periods, for example, Monday to Friday, 9:00 a.m. to 5:00 p.m. In Performance Summary Reports, you select either All Hours, Business Hours, or Non-Business Hours to filter the timeframe of any report.
The Performance Summary Report now includes Component Type support. This has been expanded from the core base objects to components in the form. You select the Component Type from the drop-down list, then you select the relevant Metrics Class type for that Component Type, and finally the relevant Metrics.
AWS C2S
NetIM supports AWS C2S extremely secure cloud computing for the U.S. Intelligence Community. The AWS Secret Region can operate workloads up to the Secret U.S. security classification level. Cloud security at AWS is the highest priority. AWS customers benefit from data center and network architecture built to meet the requirements of the most security-sensitive organizations.
Out-of-the-box metrics
This release added new out-of-the-box metrics, including a slew of Wireless LAN Controller metrics, F5 Load Balancer System Throughout, Group Status, and, of course, Site Gateways Status.
To summarize, NetIM 2.4 is a vital release that totally revamps how NetIM manages alerting, it also takes a major step forward in managing and reporting on synthetic and IP SLA tests, among an array of other updates.
Existing Riverbed NetIM customers with support contracts can download version 2.4 from the Riverbed Support Site. Customers running NetIM 1.x and NetCollector customers can easily upgrade to NetIM. Ask your Riverbed account manager for details.
